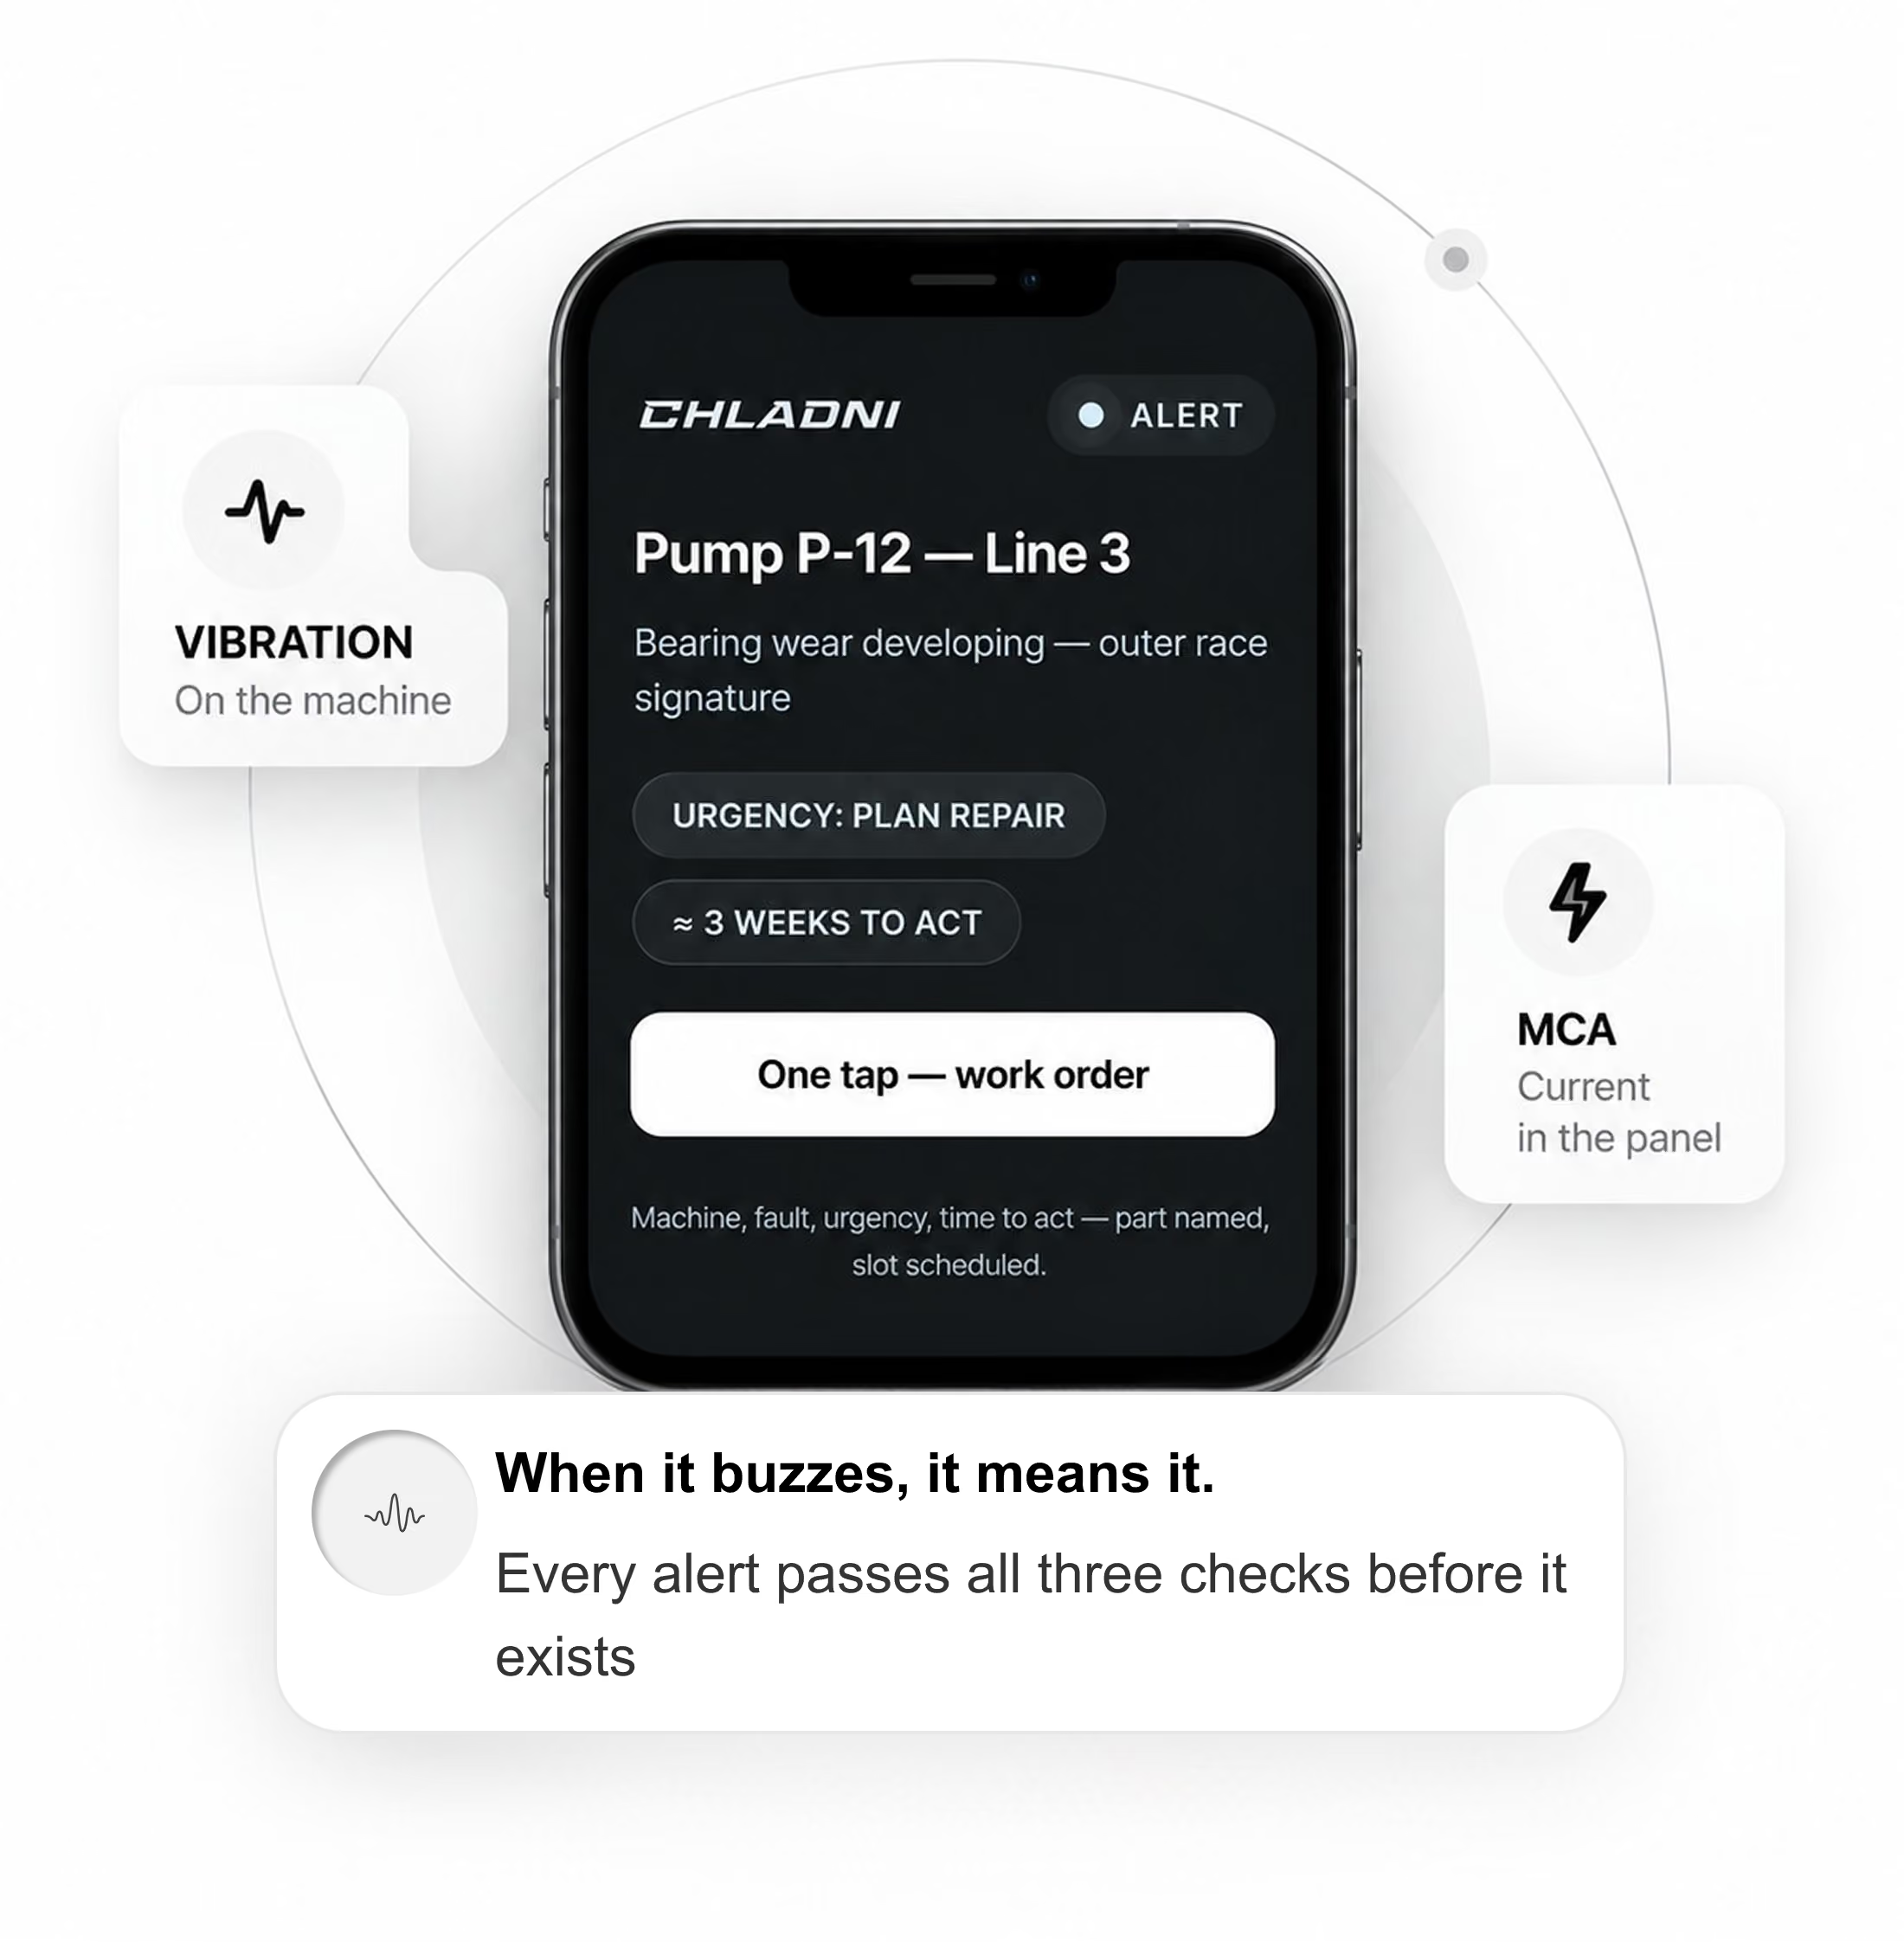
If a motor's in the circuit, we hear it.
No motor - tanks, piping, structure - we'll tell you straight, free, off your machine list.
Or call us: +1 945-206-2195. A human answers.

Products · Platform
Meet the Chladni platform.
One platform to monitor every asset, detect faults before they escalate, manage work orders, and keep your entire maintenance operation running - all from a single dashboard your team already knows how to use.
Everything your maintenance team needs. Nothing they don't.
Dashboard.
Every asset, every alert, every open work order - one view, always current.
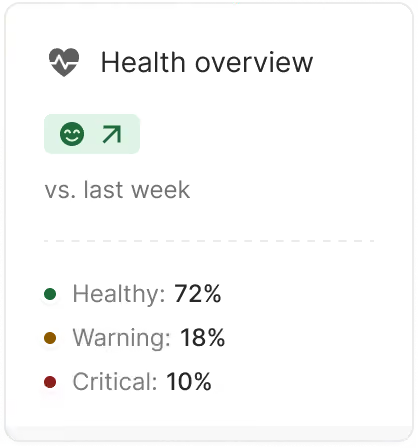
Health Overview
See the health score of every monitored asset at a glance. Assets in warning or critical state surface automatically - no filtering, no searching.
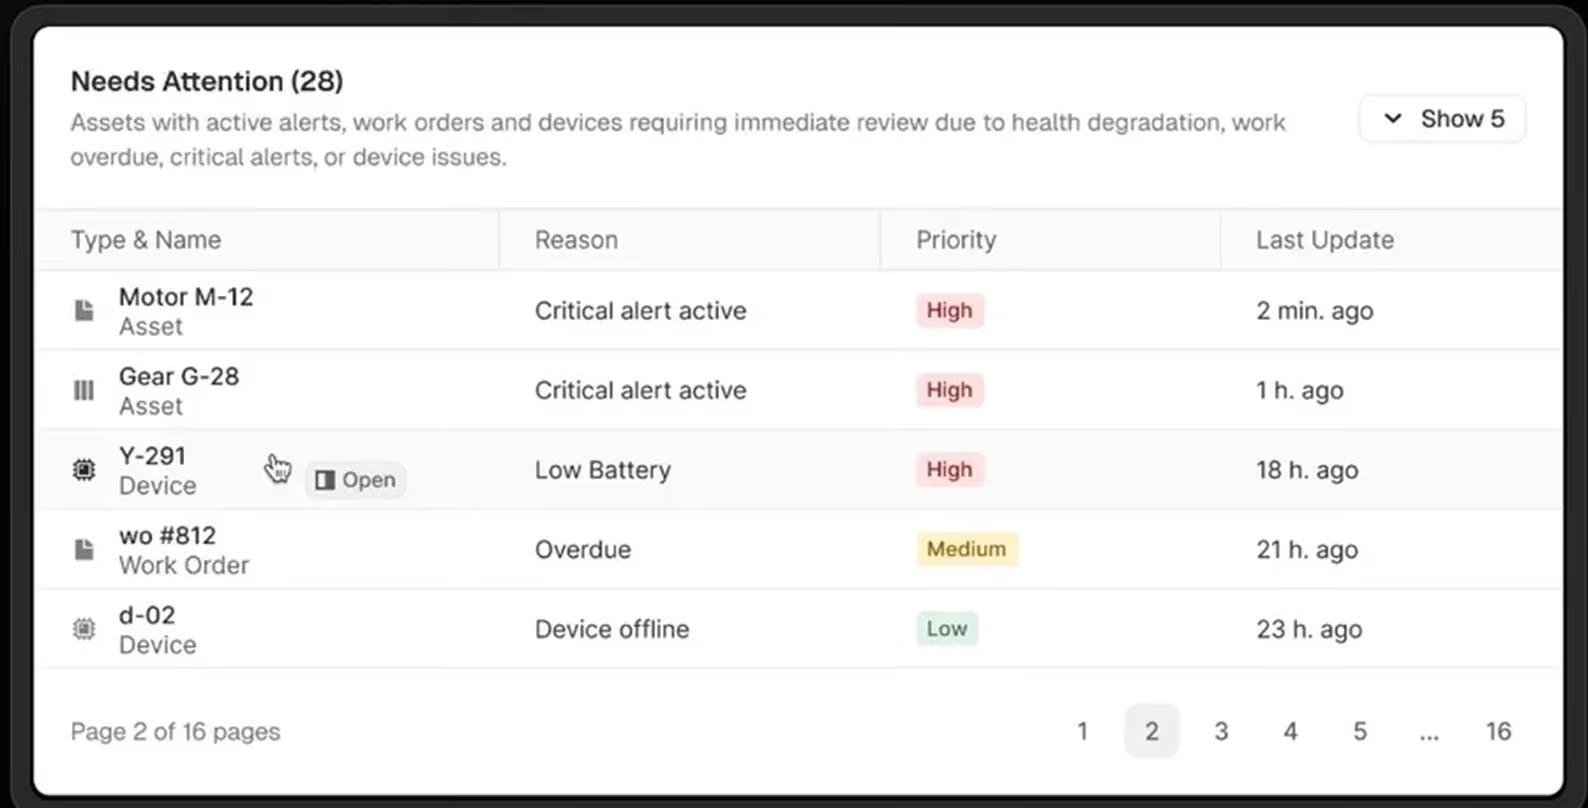
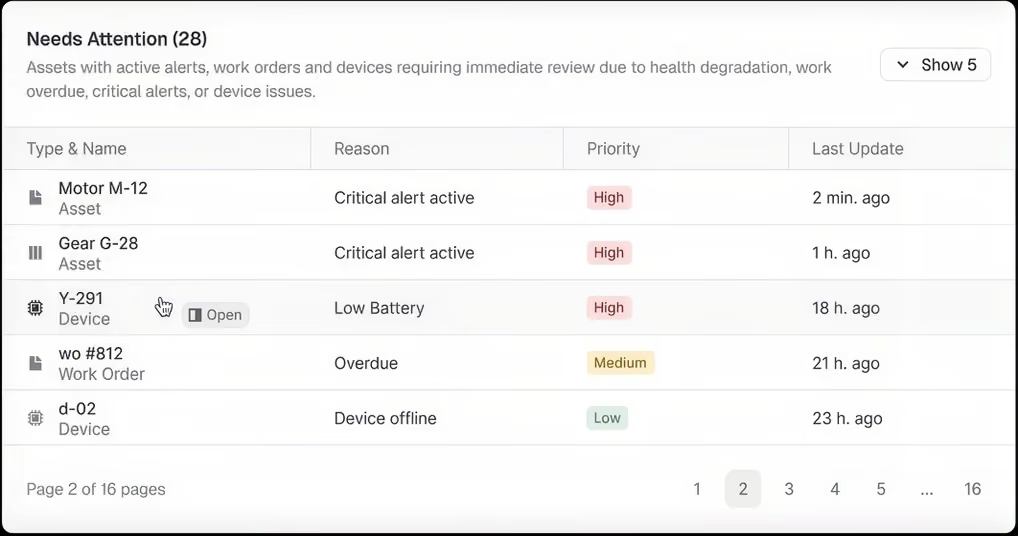
Needs Attention
Assets with active alerts, overdue work orders, or offline devices rise to the top automatically. Priority-ranked so your team knows exactly where to start.
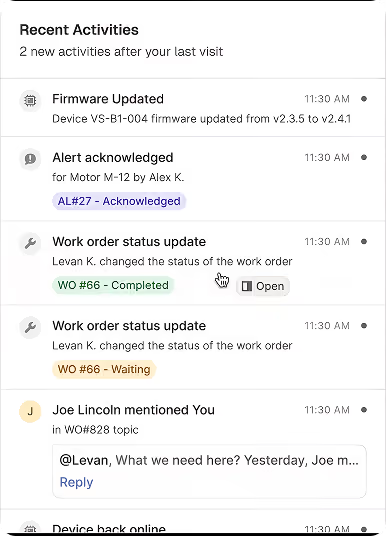
Recent Activity
Every action taken across the platform - alertsacknowledged, work orders updated, firmwarechanged - in a live feed your whole team canfollow.
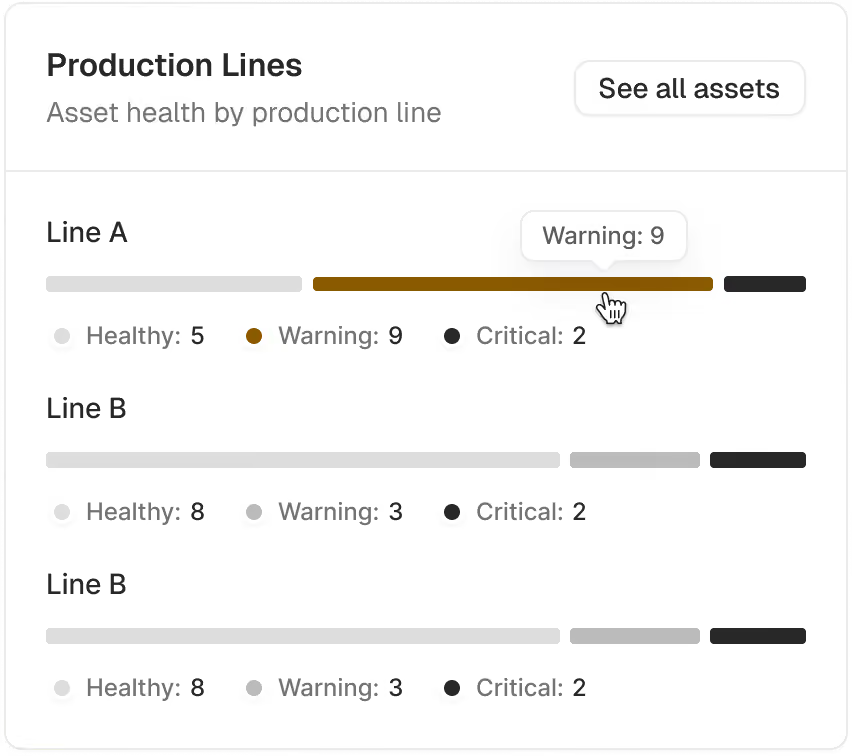
Production Lines
Asset health broken down by production line. Spot which line is underpressure before it becomes a floor problem.
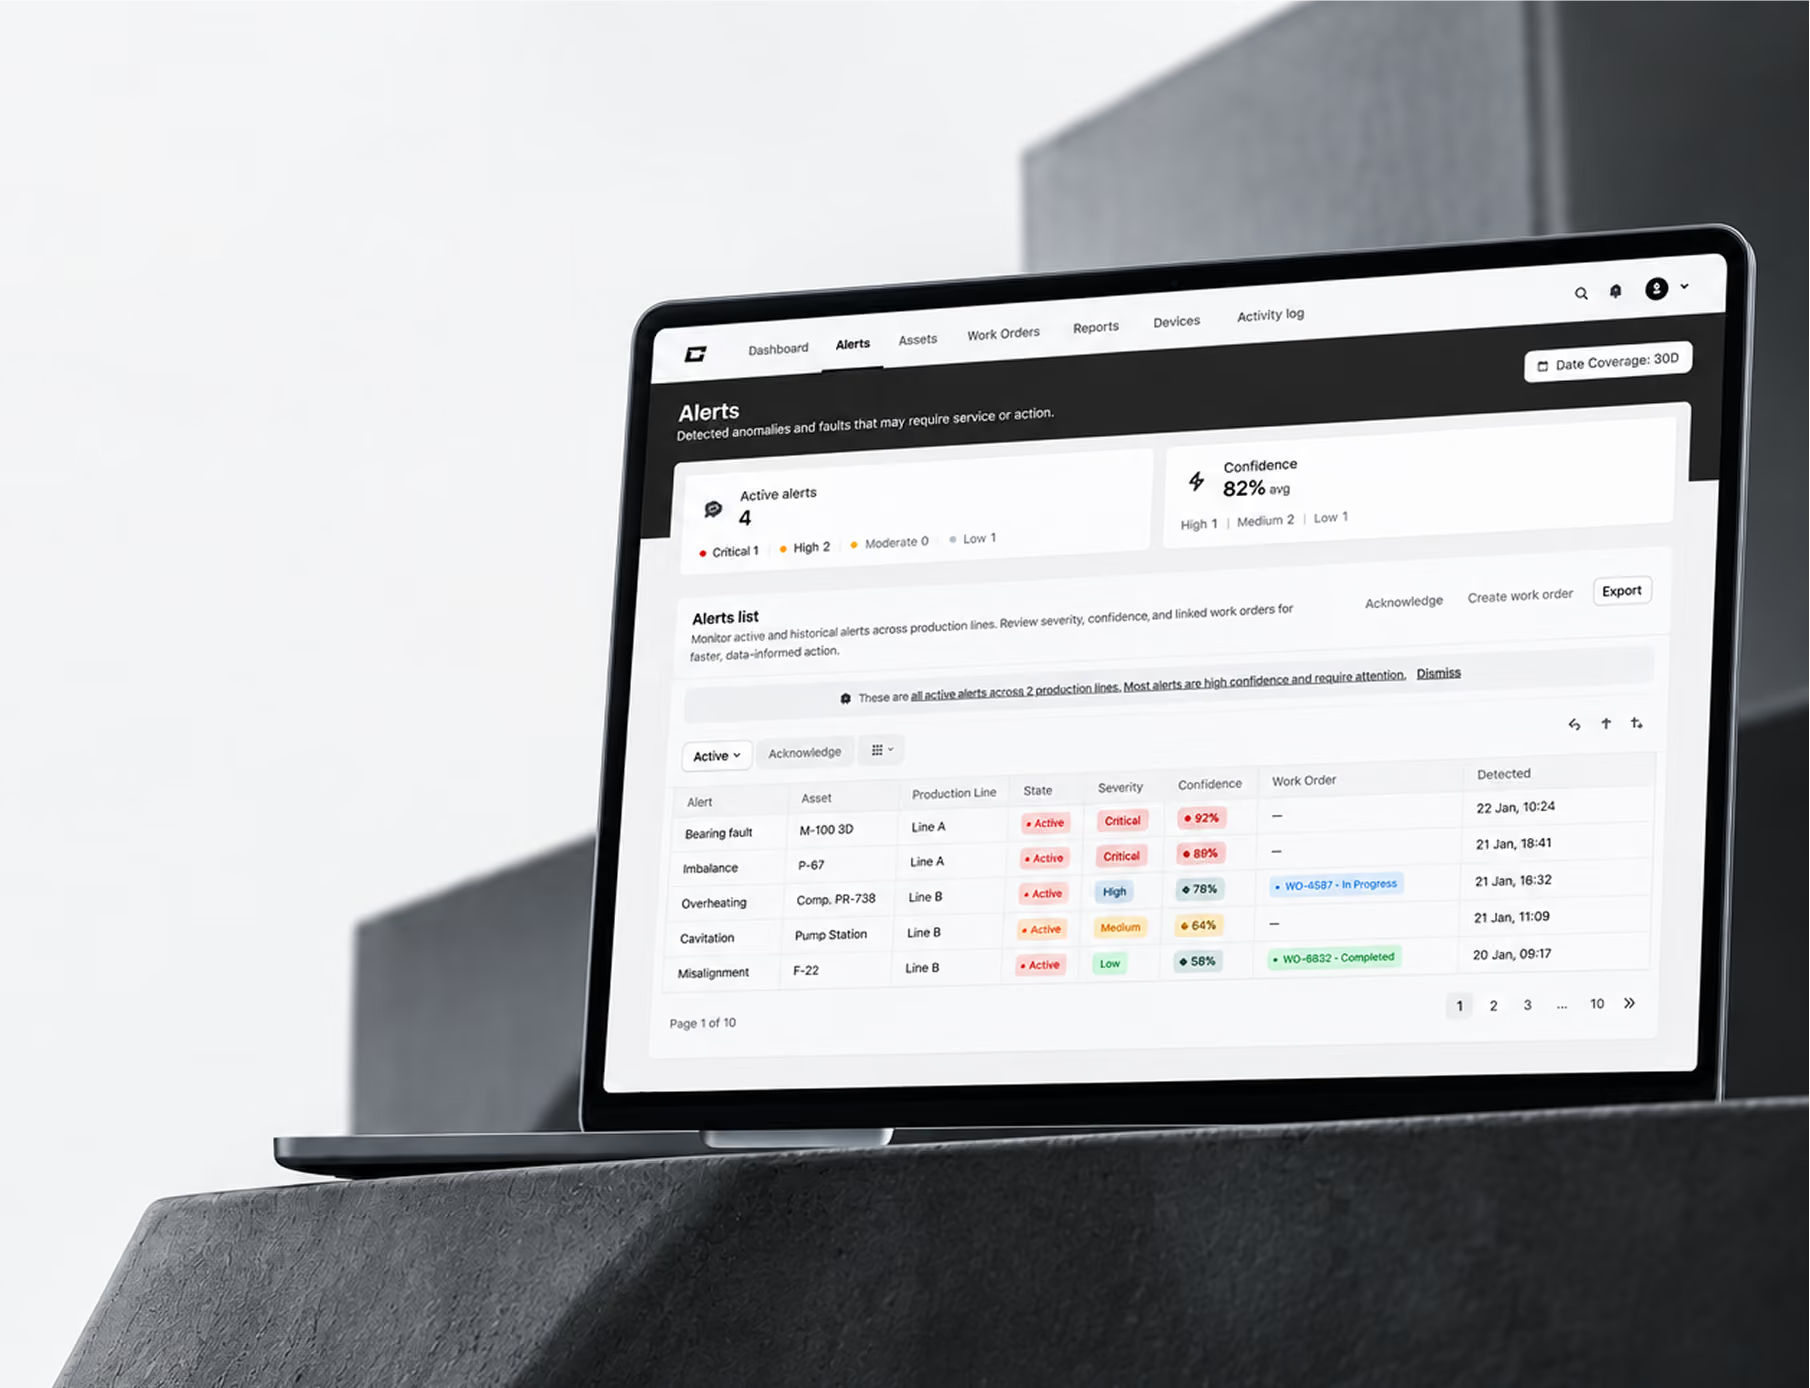
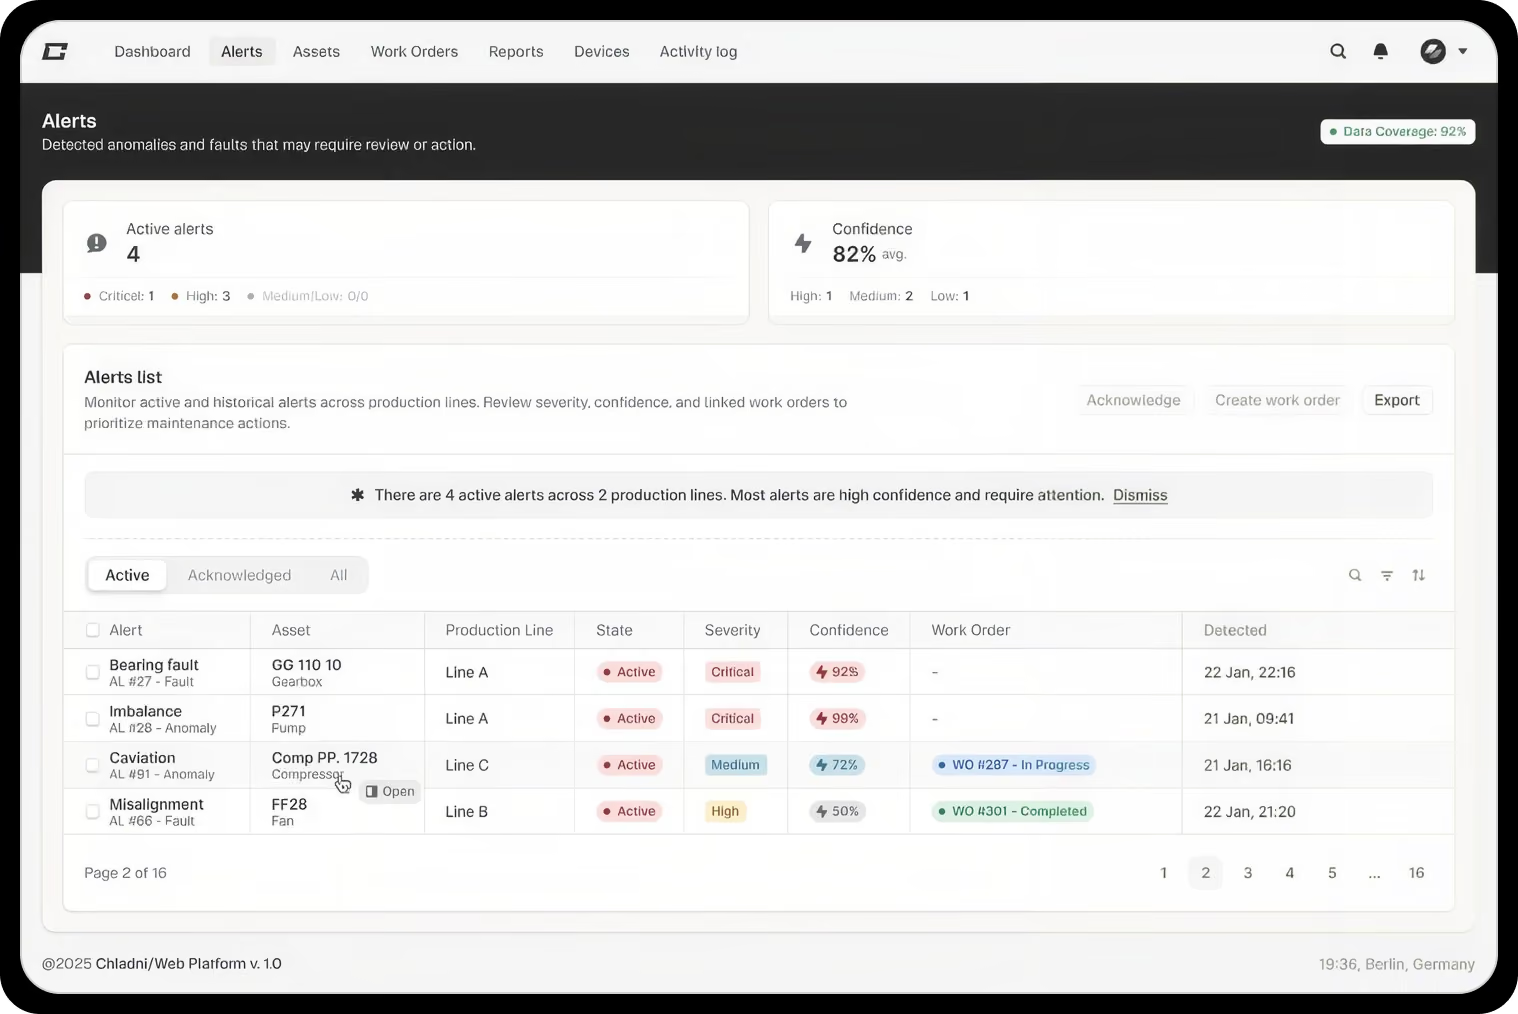
Alerts.
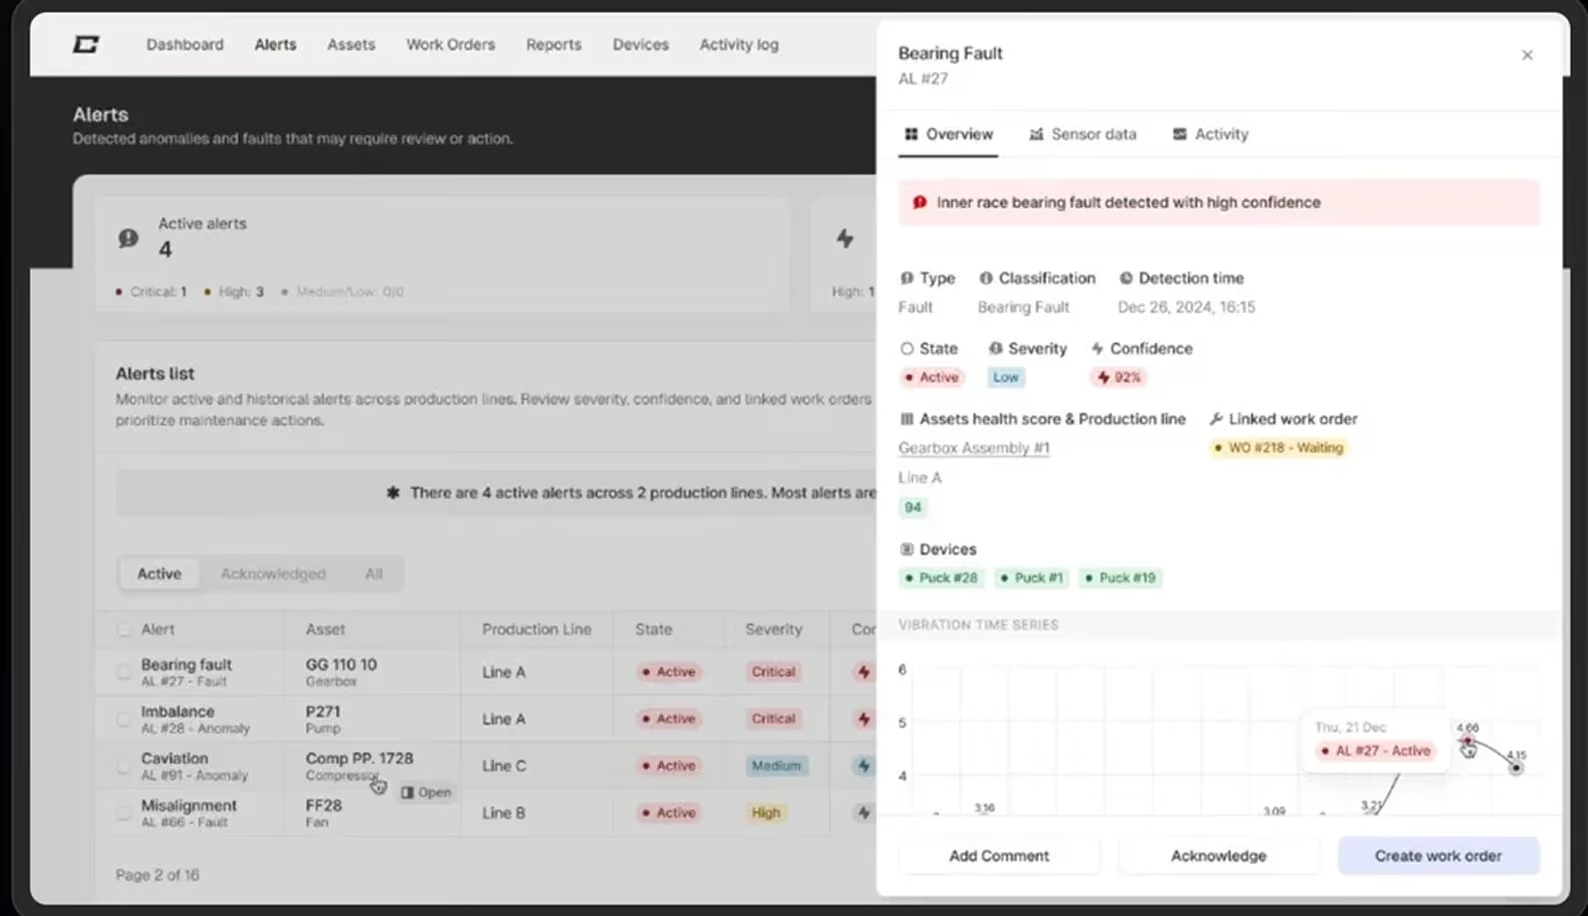
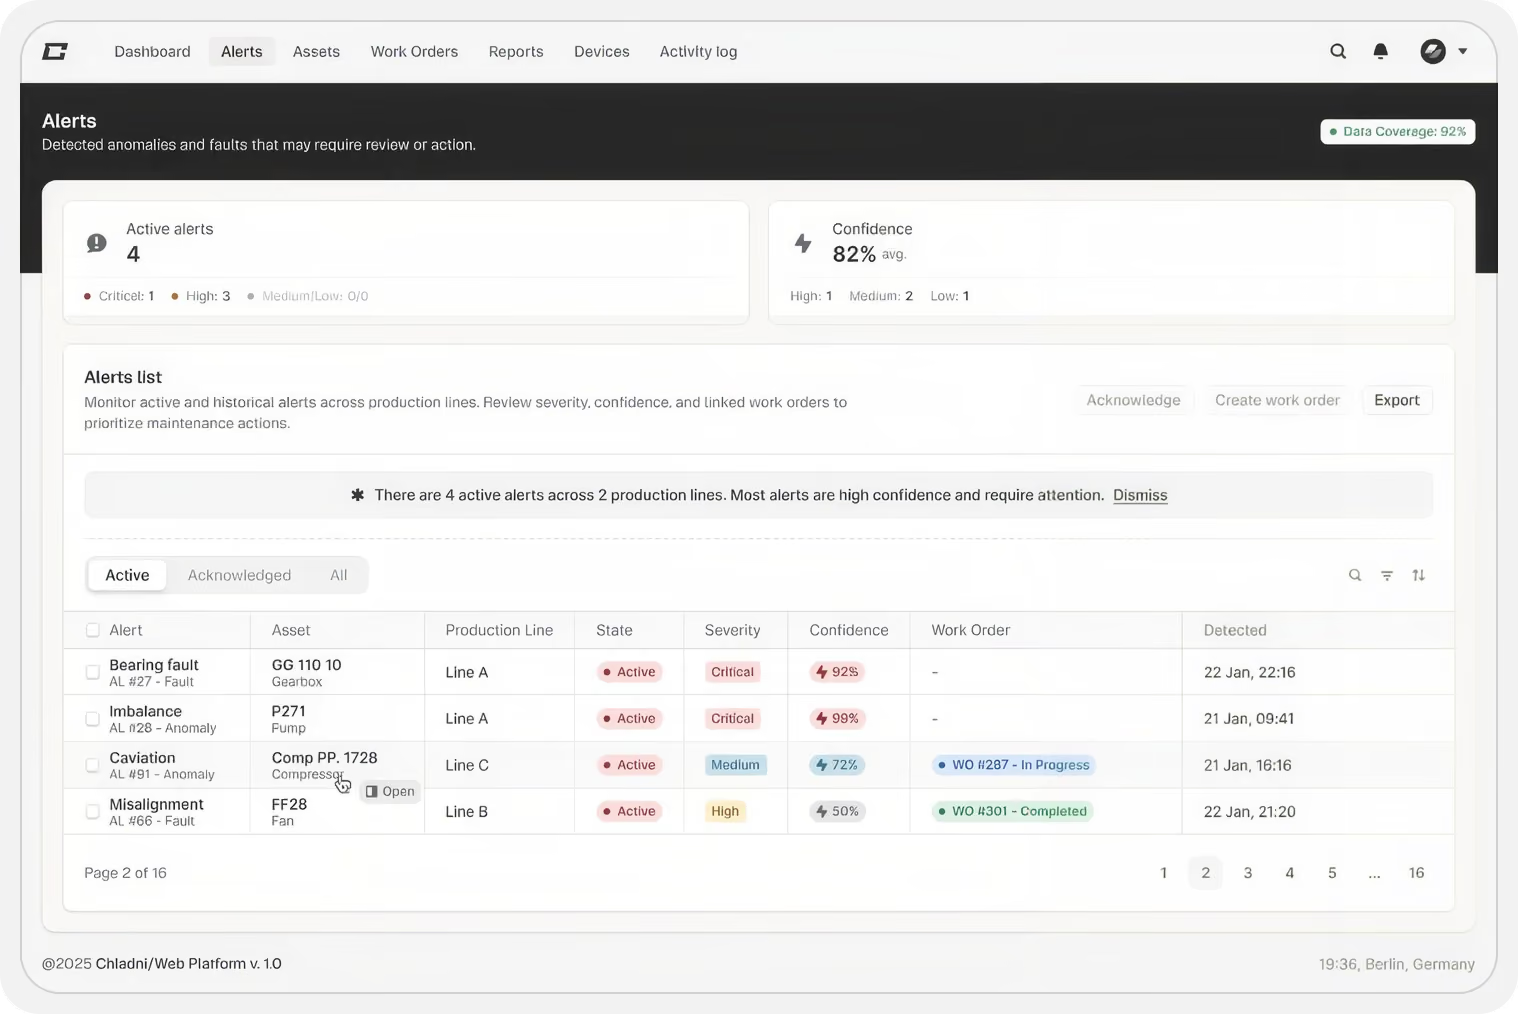
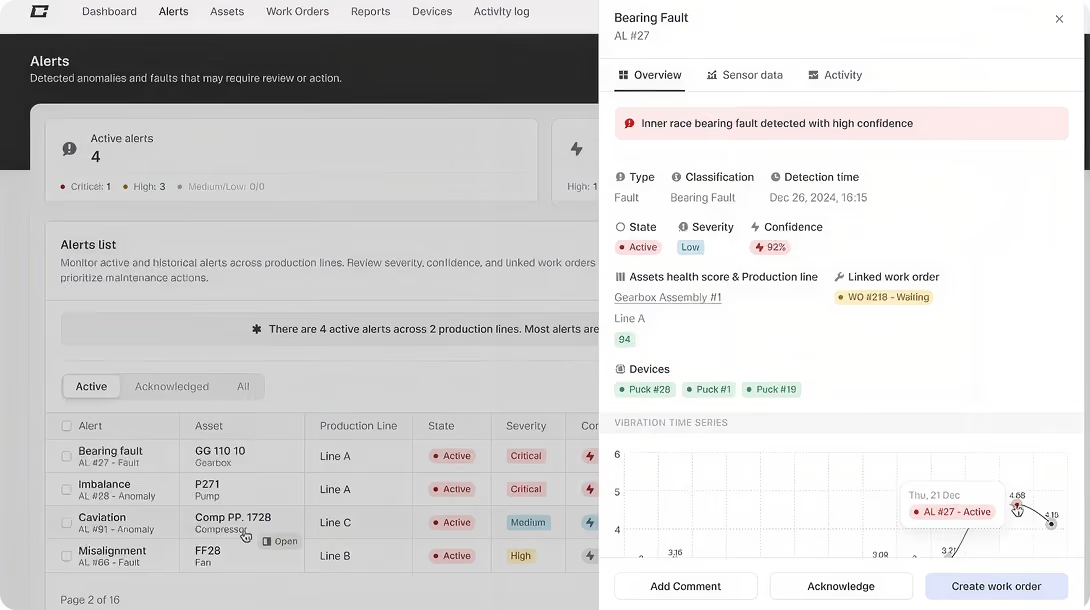
Named faults, not noise. Every alert tells your team what's wrong, how confident the detection is, and what to do next.
Fault Detection
Two independent systems run on everysensor upload. Neither waits for the other.
The physics rules engine looks for frequency patterns associated with known fault types. The machine learning classifier runs a neural network trained on labeled fault examples. An alert fires when either reaches sufficient confidence - whichever comes first.
Severity
Every alert carries a confidence-derived severity - Critical, High, Medium, or Low. Severity updates upward automatically if subsequent readings arrive with higher confidence.
Fault types
Alerts name the cause, not just the symptom. Bearing defects, shaft misalignment, rotor bar cracks, voltage imbalance - each alert tells your team exactly what the machine is showing.
Status tracking
Every alert moves through three states: Active when first detected, Acknowledged once under investigation, Resolved once addressed. Nothing falls through the cracks.
Assets.
Every machine on your floor, fully visible. Health score, active alerts, linked work orders - all in one place, always current.
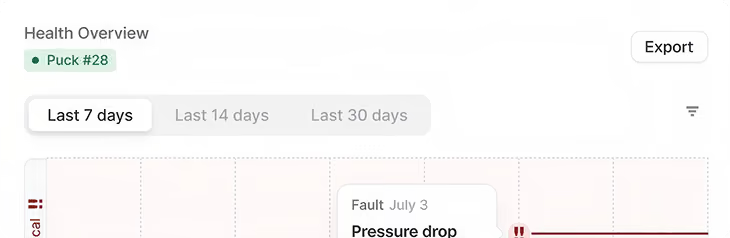
Health Overview
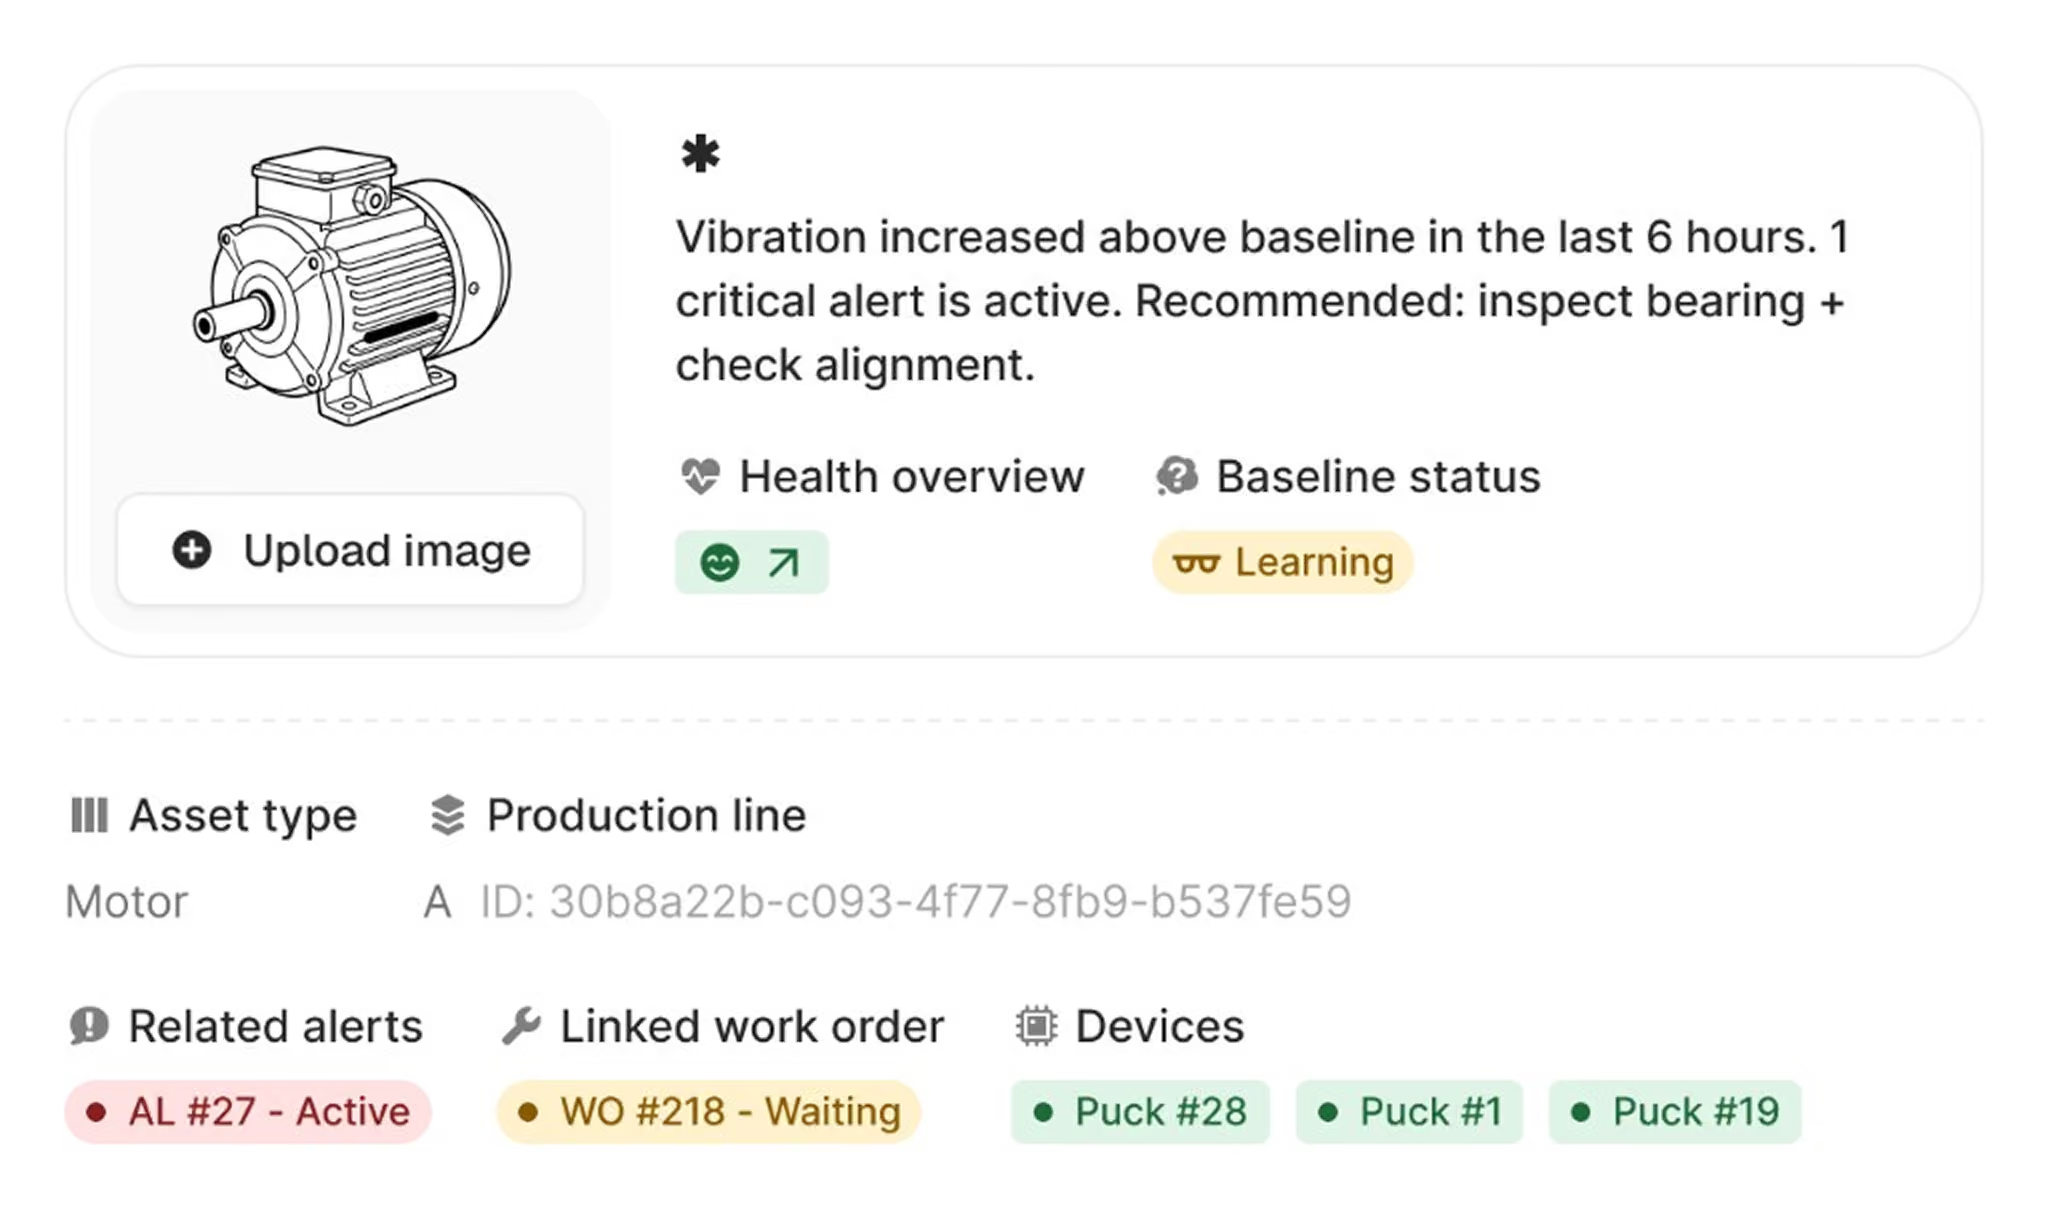
Every asset carries a live health score with trend direction. See at a glance whether a machine is improving, stable, or deteriorating - and how many days it may have before reaching critical.
Fleet Overview
Your entire asset base, ranked by what needs attention first.
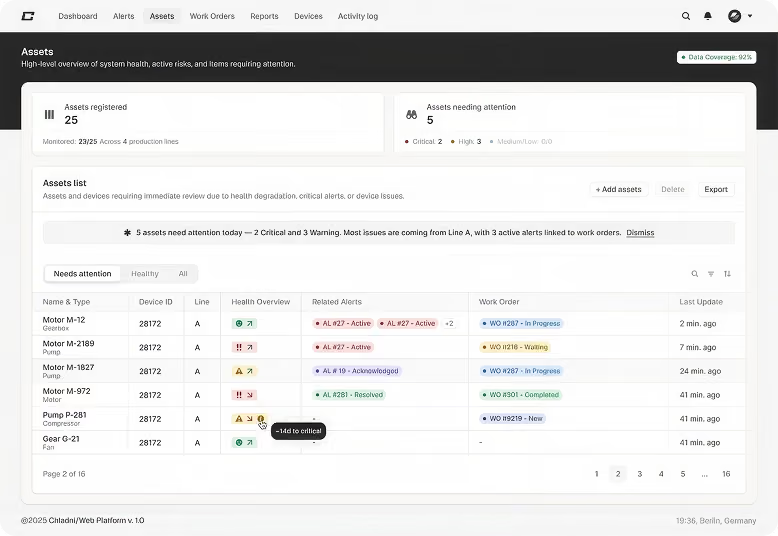
Assets with active alerts, falling health scores, or offline devices surface automatically under Needs Attention. Nothing requires manual filtering to find what's urgent.
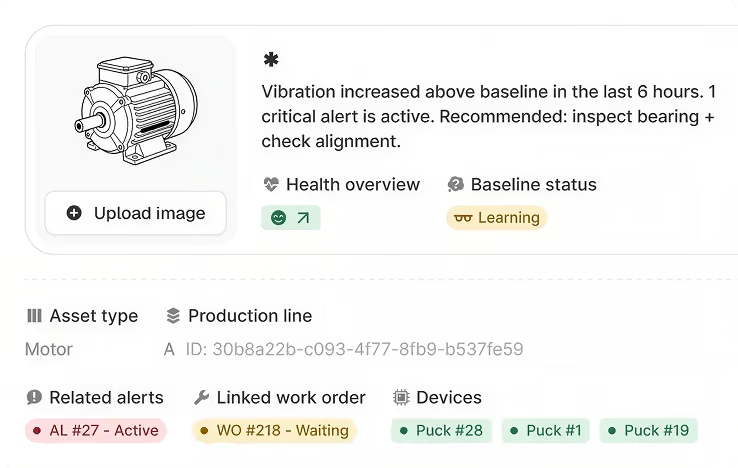
Full Asset History
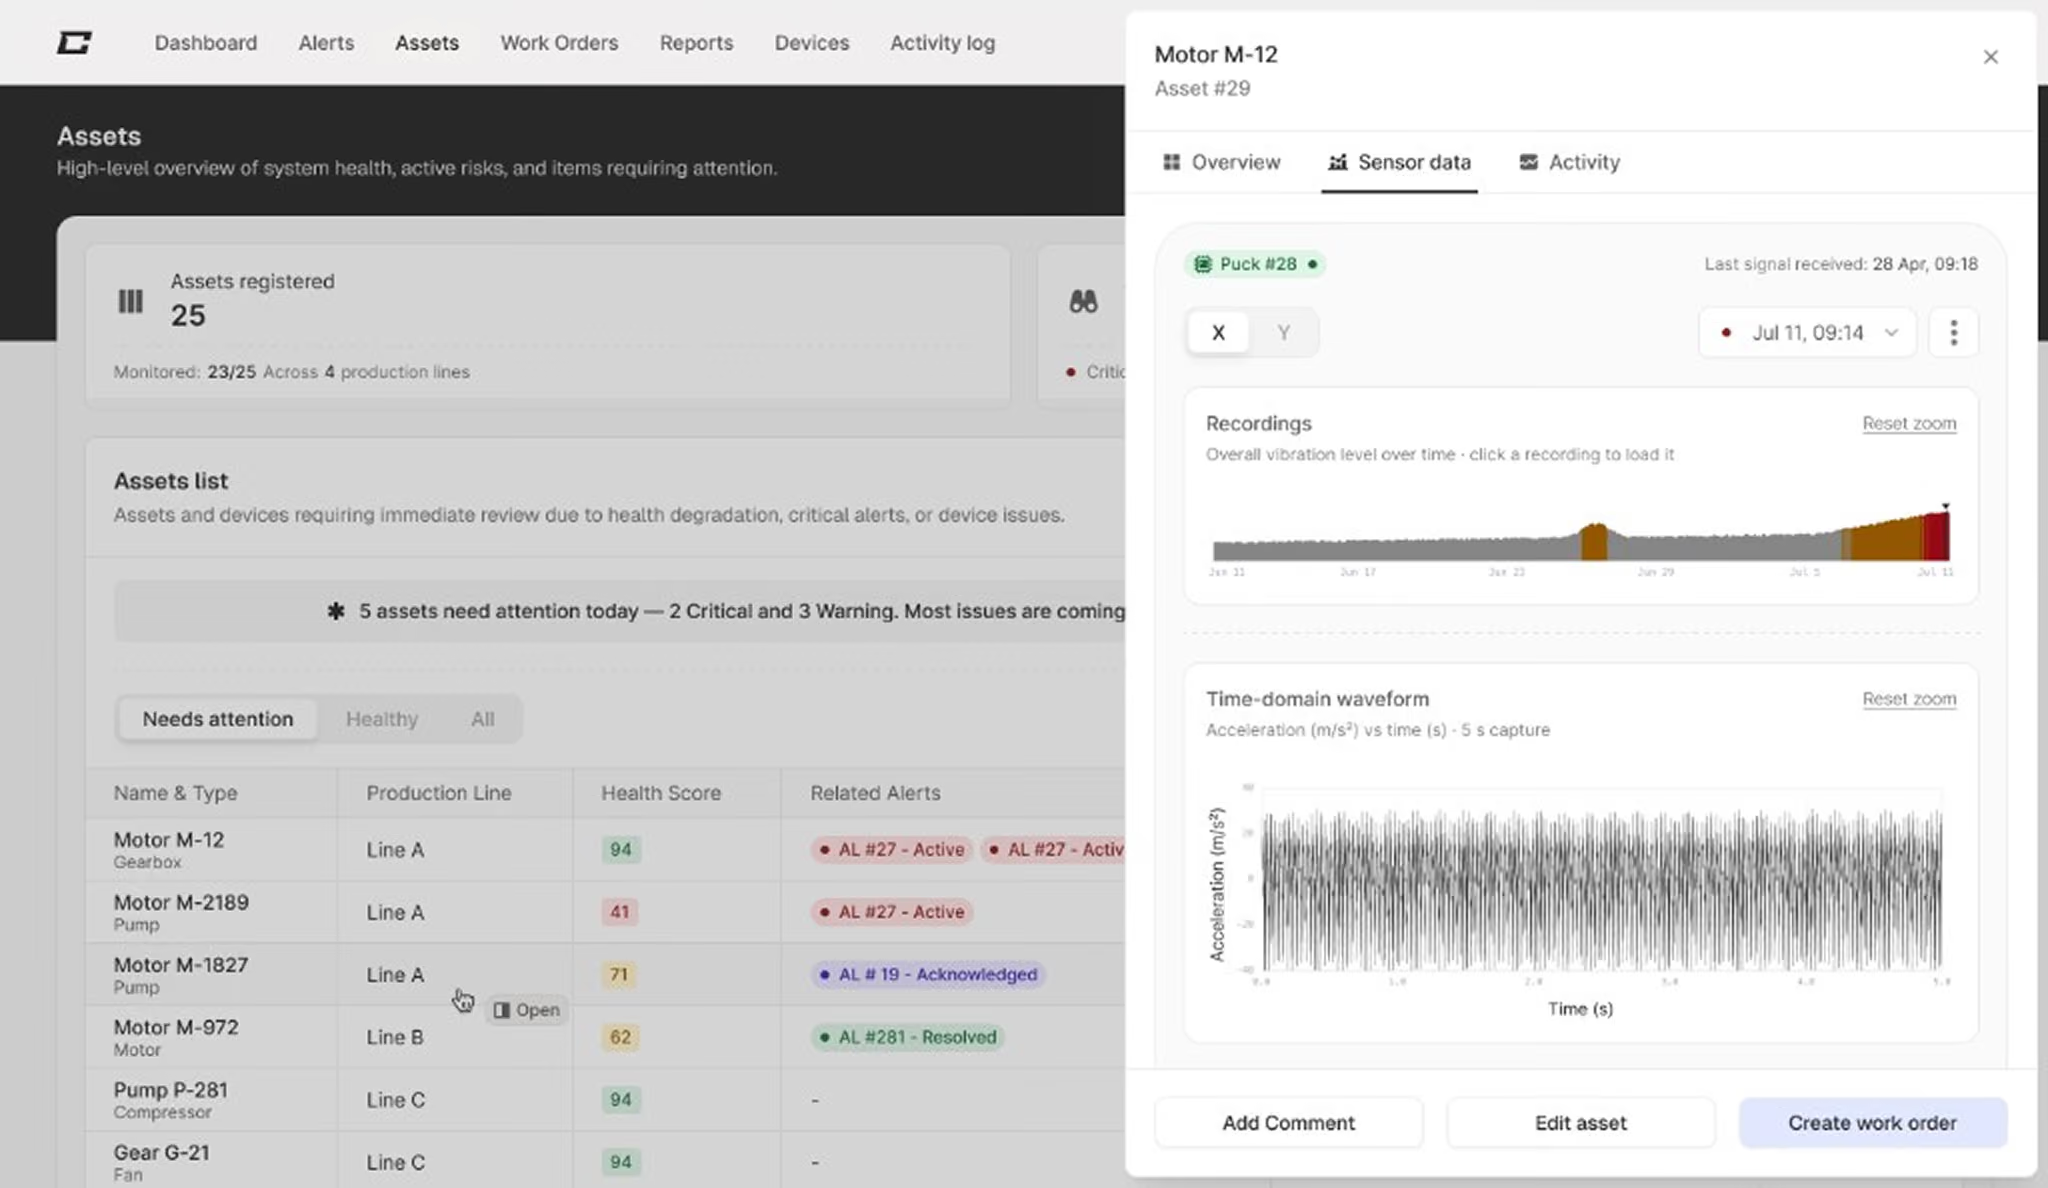
Click any asset to see its complete sensor history, related alerts, linked work orders, and connected devices - all in one panel. Every decision your team makes has the full context behind it.
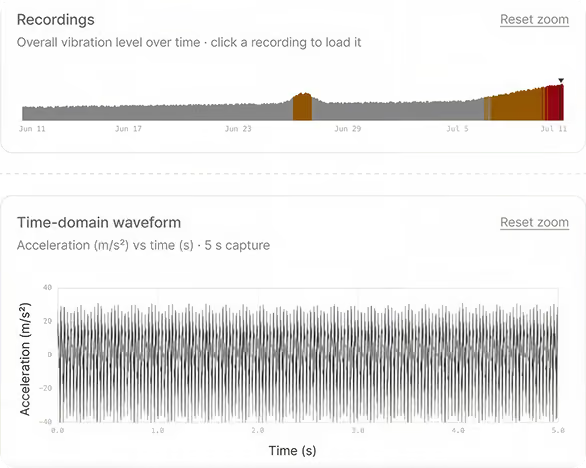
Sensor Data
Raw vibration recordings, time-domain waveforms, and FFT charts available directly on the asset. Your team can inspect exactly what the sensor captured at any point in time.
Work Orders.
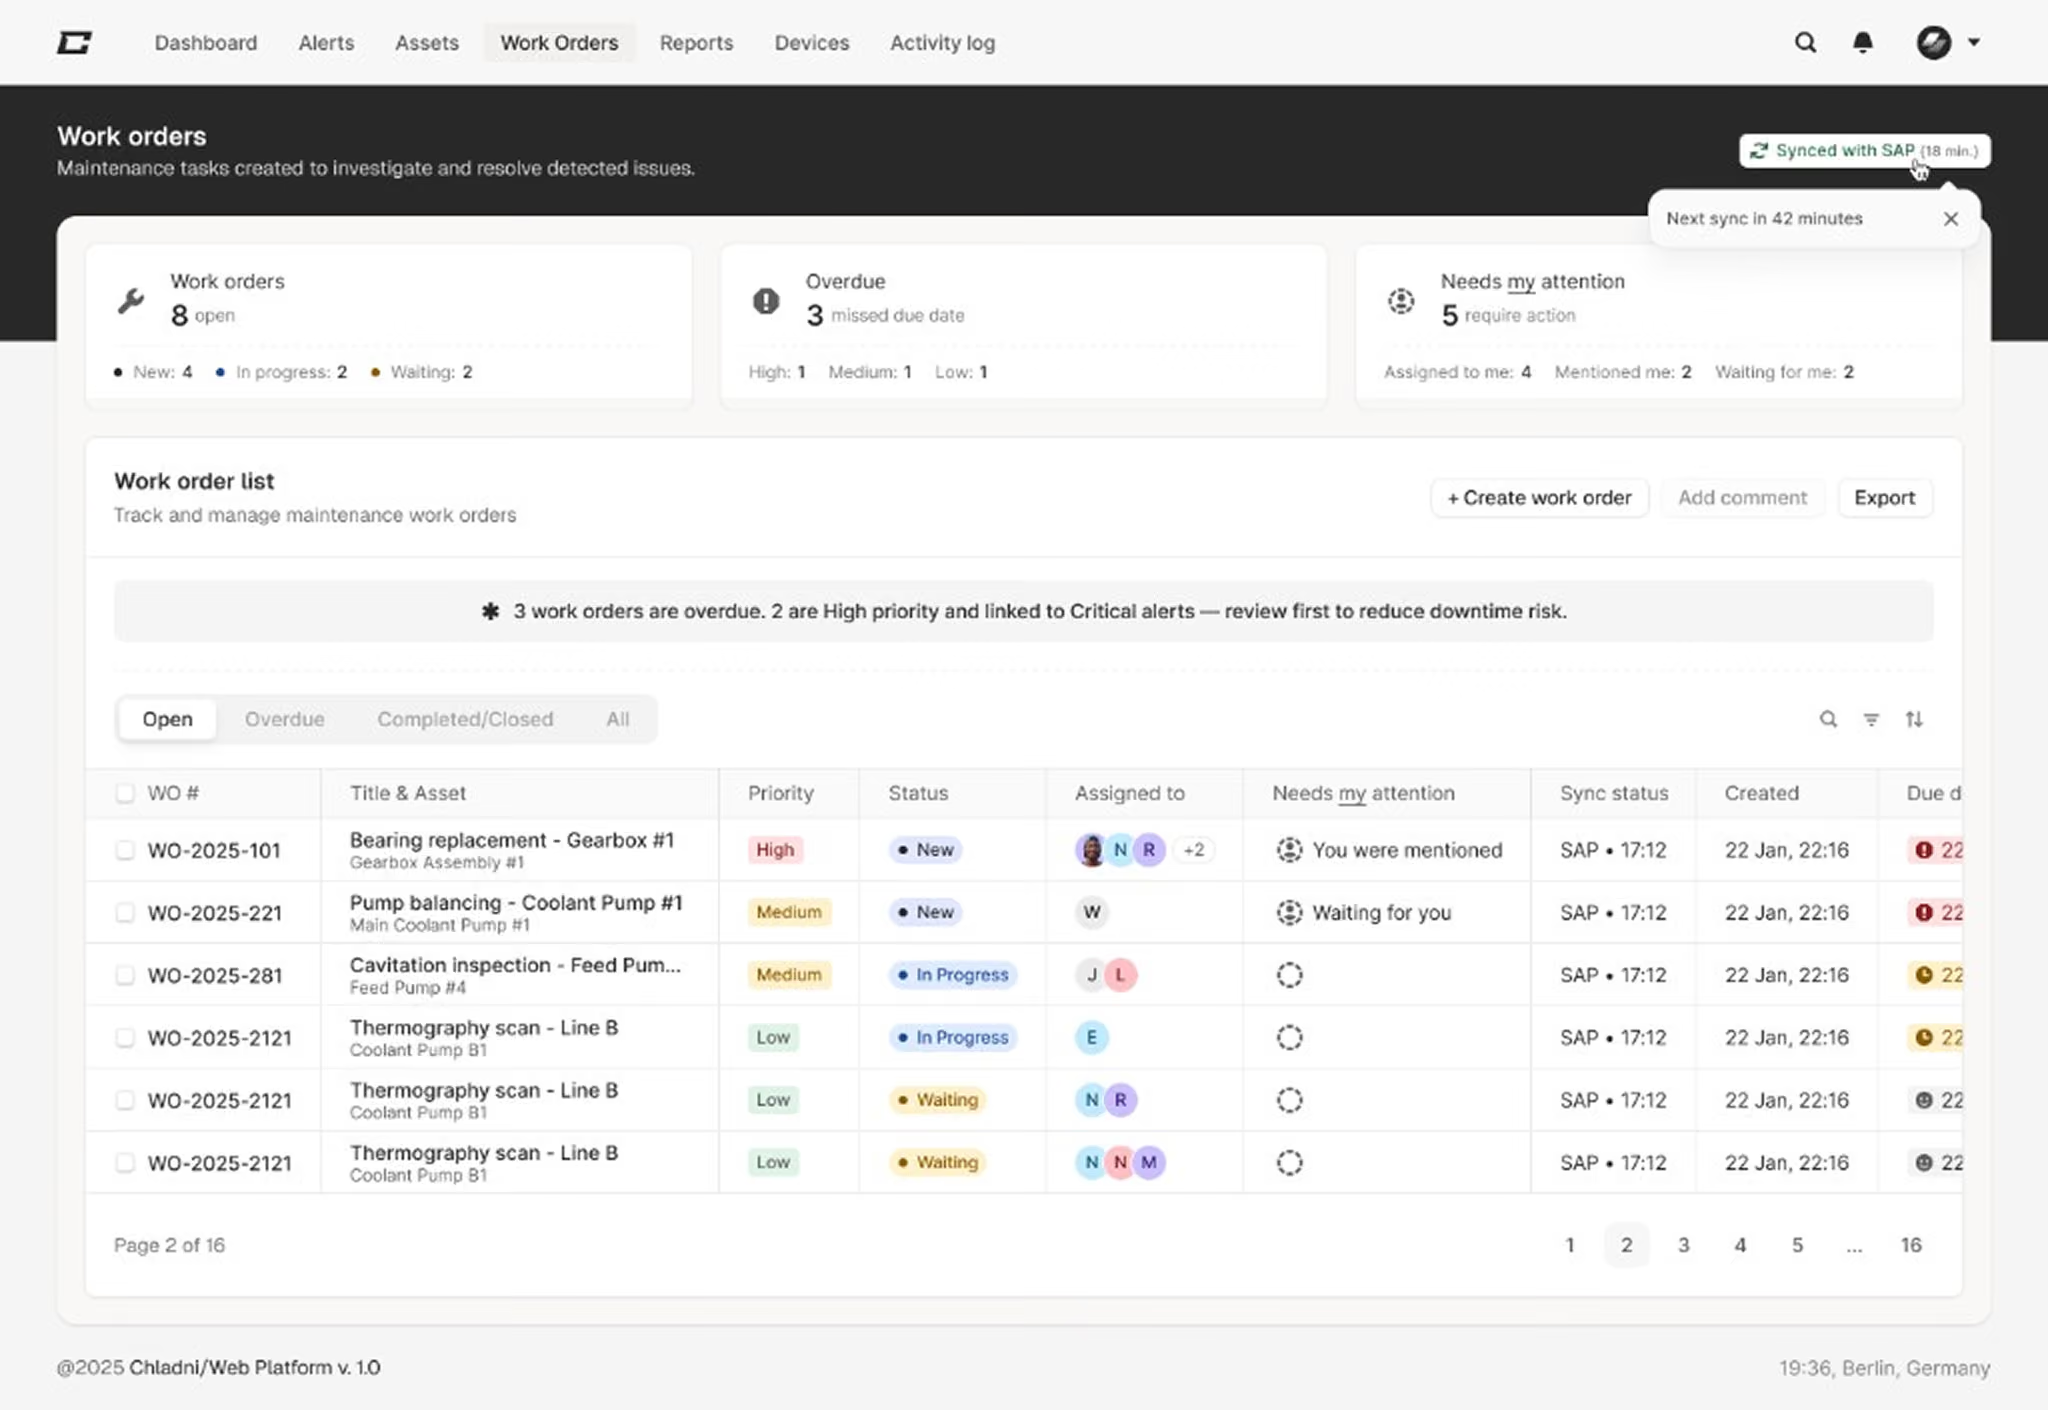
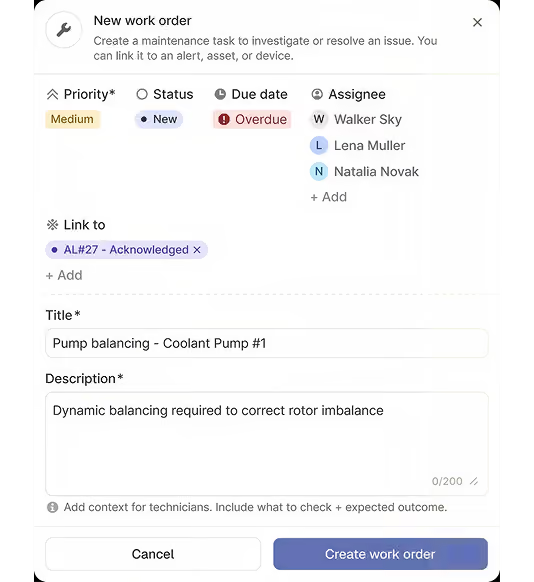
From detected fault to assigned job, in one step. Every work order carries the alert, the asset, and the full context behind it.
From Alert to Action
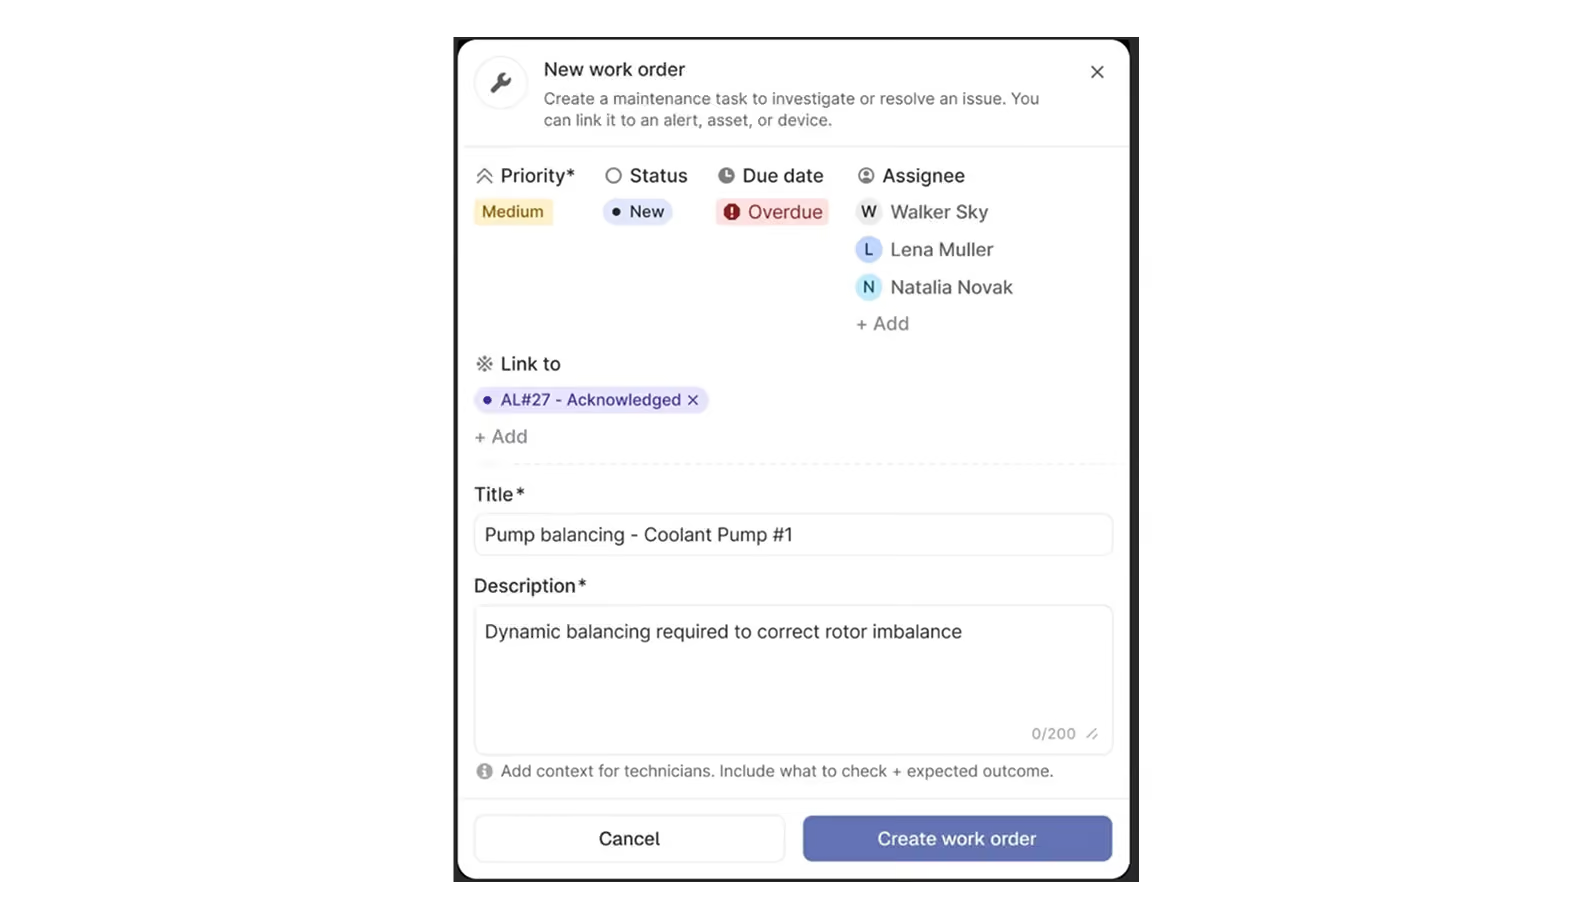
A detected fault becomes a work order in one click. The response never leaves the platform.
Work orders can be created directly from an alert, so the linked fault, affected asset, and health score travel with the task. Technicians get the full picture, not just a title.
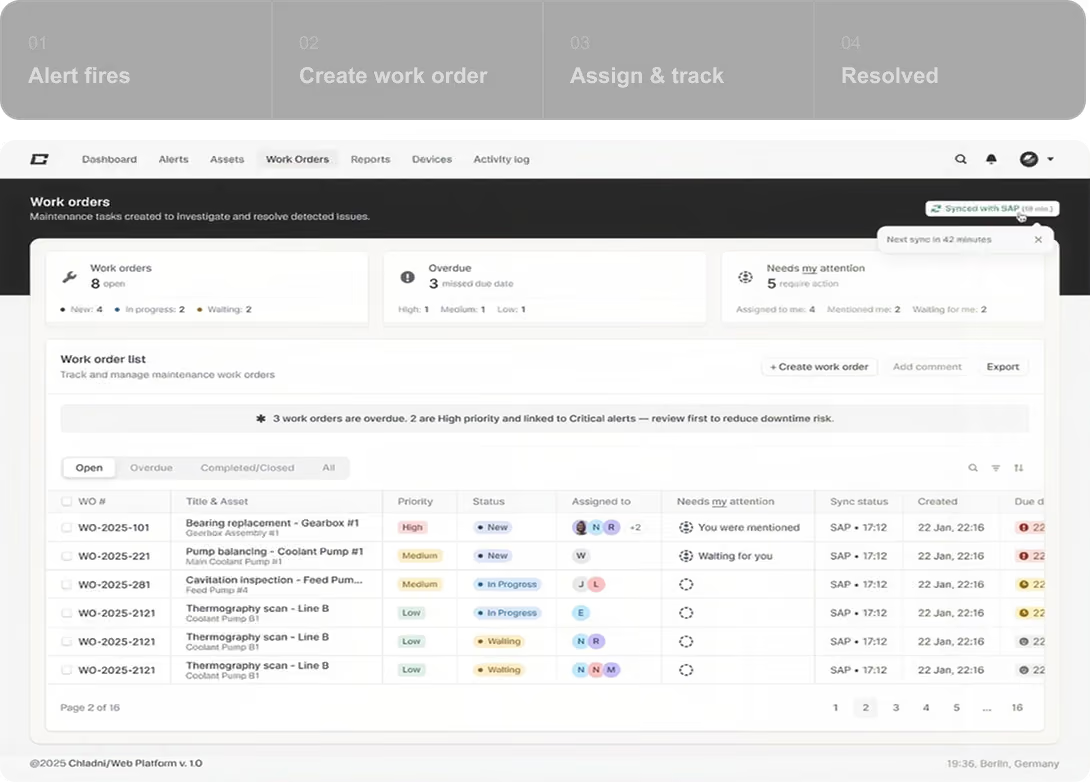
Priority & Status
Every work order carries a priority and moves through clear states - New, In Progress, Waiting, Completed, Closed. Overdue and at-risk orders surface automatically so nothing slips.
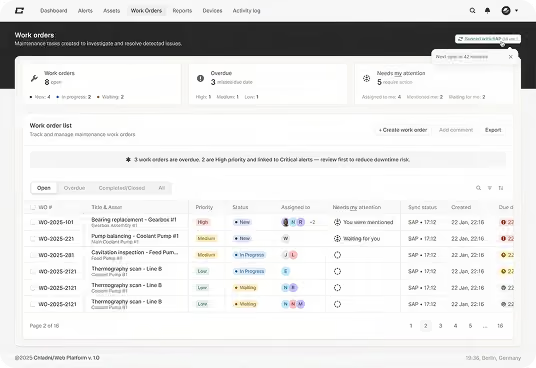
Assign & Collaborate
Assign to one person or a team. Mentions, comments, and a "Needs my attention" view mean everyone knows exactly what's waiting on them.
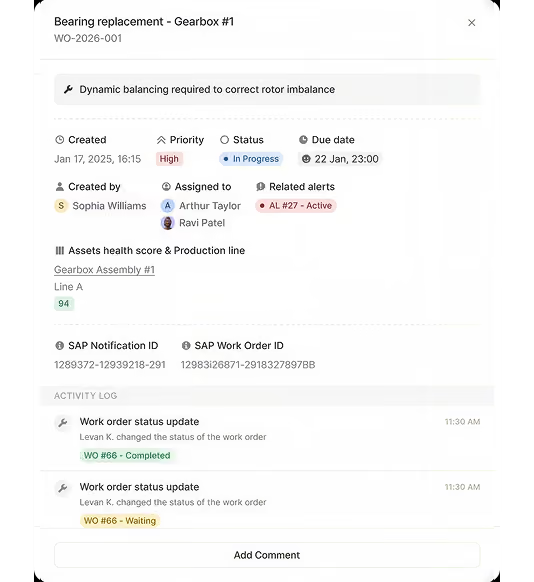
SAP Sync
Work orders sync bi-directionally with SAP, carrying Notification and Work Order IDs both ways. Your maintenance system of record stays current without double entry.
Devices.
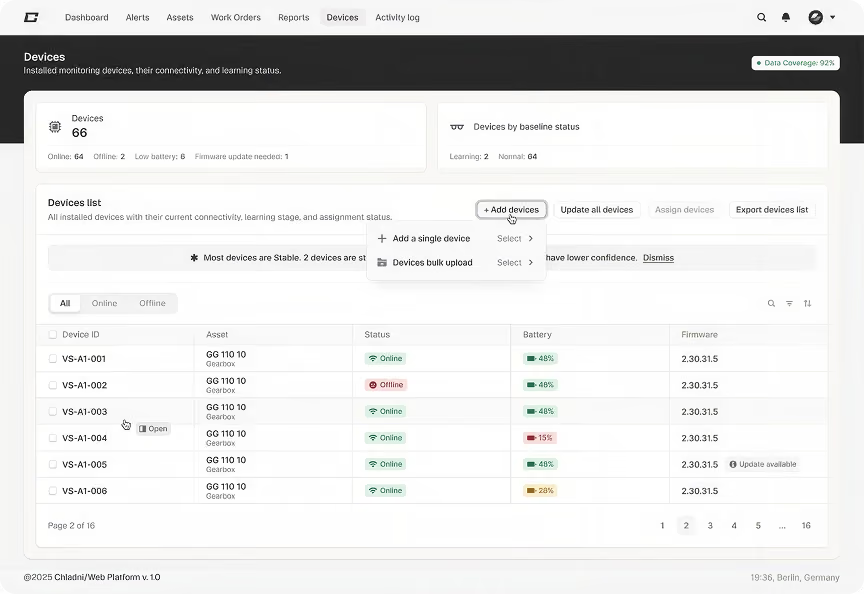
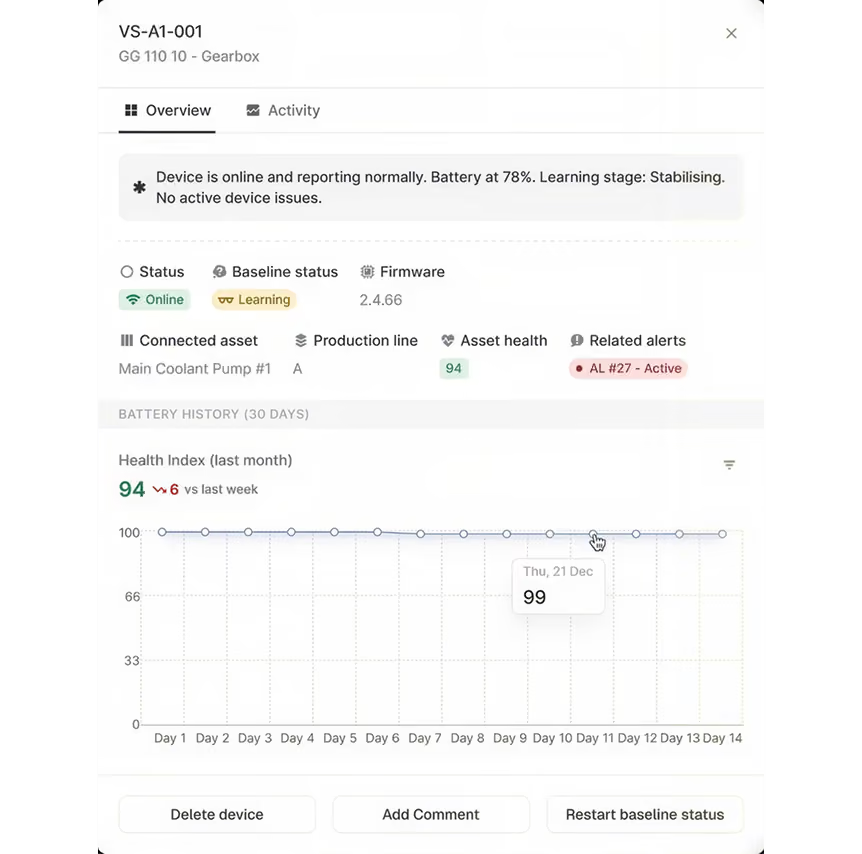
Every sensor you've deployed, accounted for. Connectivity, battery, firmware, and learning status - one place to keep your monitoring layer healthy.
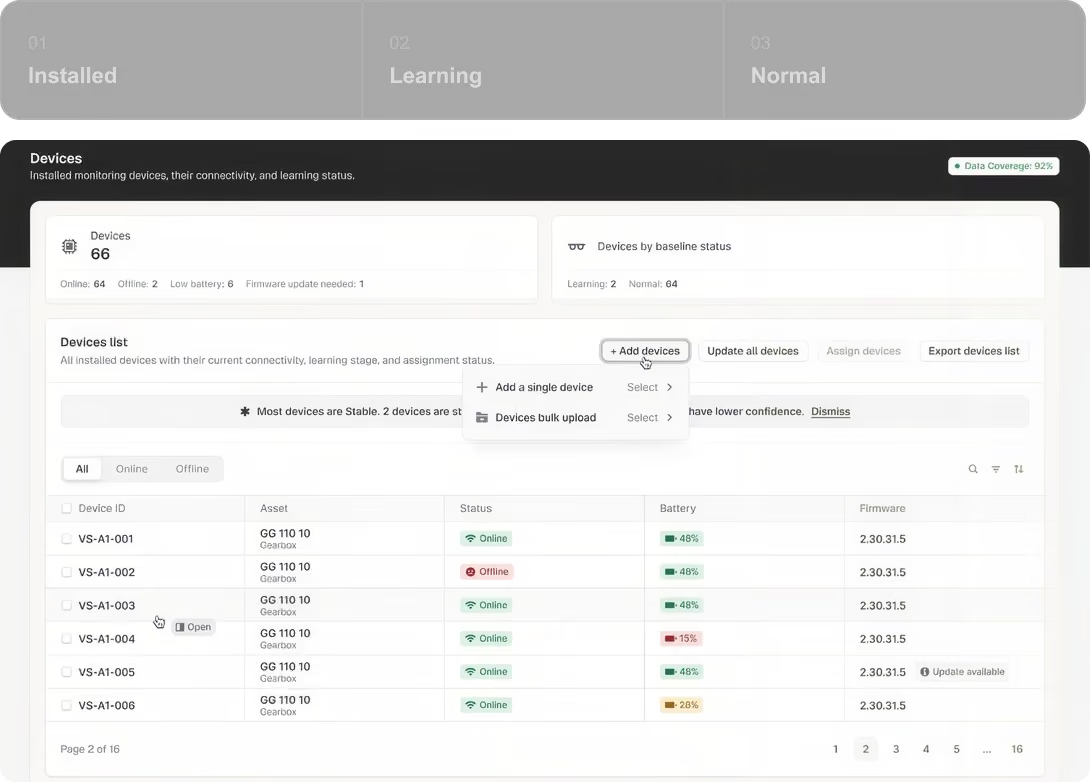
Device Lifecycle
From first install to steady-state monitoring, every device moves through the same clear stages.
A newly installed device enters Learning while it builds the machine's baseline, then moves to Normal once monitoring is active. Baseline status is visible at every step - you always know which devices are still calibrating.
Connectivity & Battery
See which devices are online, offline, or running low on battery at a glance. Fleet-level counts up top, per-device detail below - so a dead sensor never leaves a machine silently unmonitored.
Baseline Control
Every device shows its learning status and health history. Restart a baseline directly when a machine changes, and the device re-learns from its new normal.
© 2026 Chladni Industrial Systems · Predictive maintenance for motor-driven equipment